
See also


 10.11.2026 06:54 AM
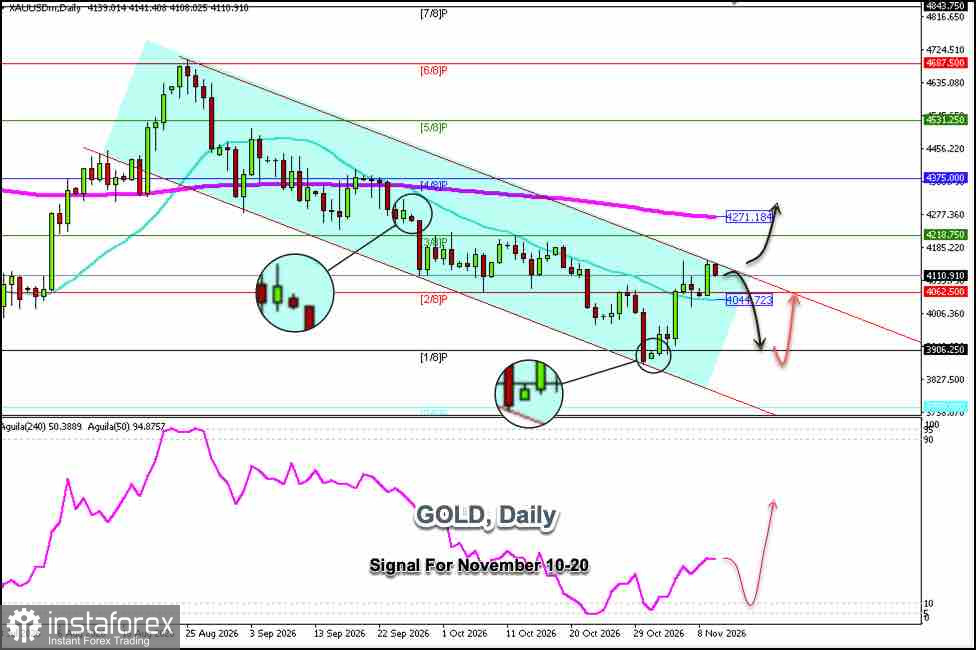
Gold is trading around 4,110, above the Murray 2/8 line and the 21-period simple moving average (SMA), and has reached a strong resistance level; therefore, we believe a technical correction could occur in the coming hours.
On the daily chart, we see that gold is moving within a bearish channel that has been forming since August 16. If the price consolidates below $4,145 in the coming hours, the outlook could remain negative, and we expect it to reach the 21-day simple moving average (SMA), around $4,044. Ultimately, we believe gold will continue to fall in the coming days until it reaches the 1/8 Murray level, around $3,906.
On October 29, gold left a gap at $3,873. If the price falls below 2/8 of the Murray level, gold could continue to fall until it reaches this level, which could be interpreted as a negative sell signal.
Conversely, a decisive break above the downtrend channel and consolidation above $4,150 could drive gold higher to reach the 3/8 Murray level, around $4,218; ultimately, we expect it to reach the 200-day exponential moving average (EMA), around $4,271.
Gold also left another gap around $4,283. If the price breaks above $4,150, we could expect it to reach this area in the coming days. Therefore, we must monitor this key level, as there is a strong possibility of a breakout, but at the same time, the price of gold is currently within a downtrend channel, so we could expect a technical correction.
You have already liked this post today
*The market analysis posted here is meant to increase your awareness, but not to give instructions to make a trade.


