
See also


 10.11.2026 07:32 AM
EUR/USD 1H Chart.
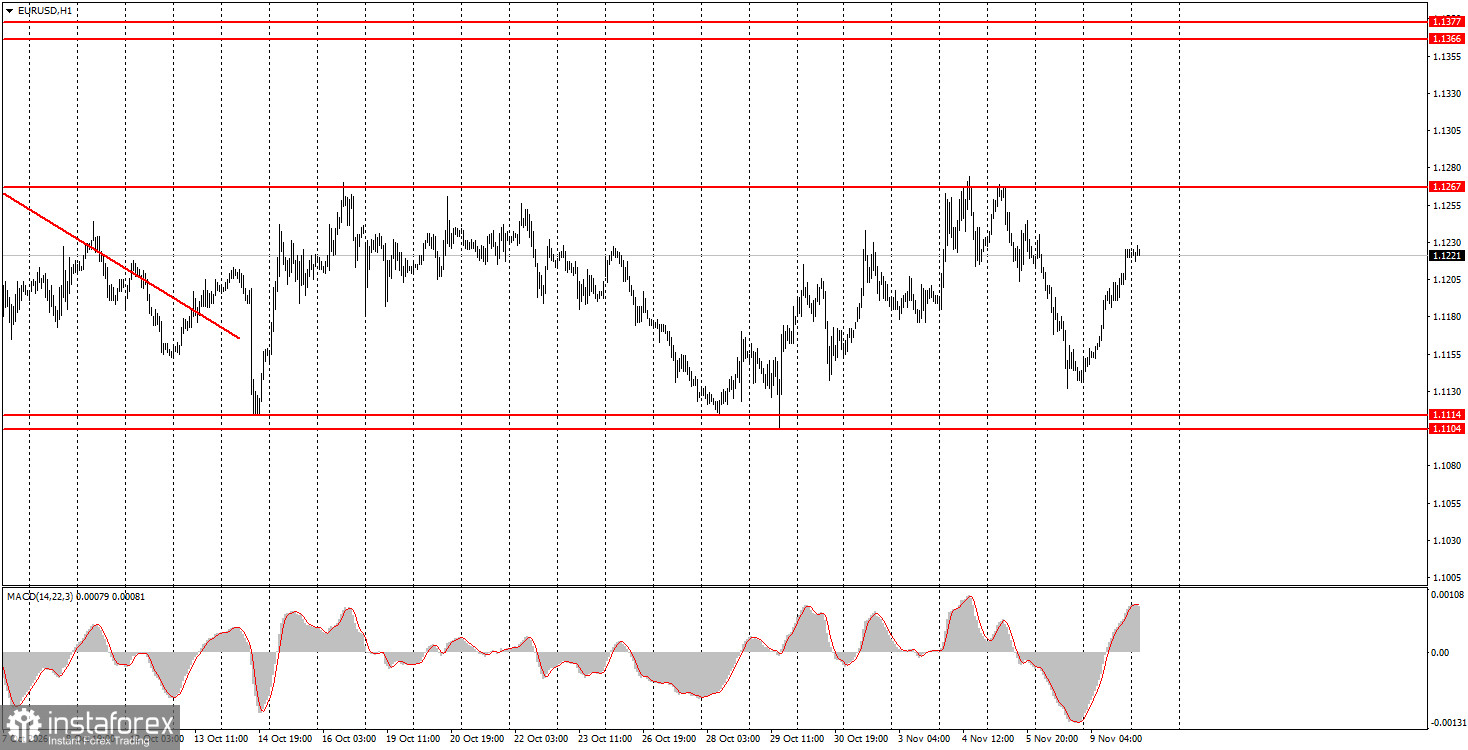
The EUR/USD currency pair recovered slightly on Monday after declining at the end of last week. However, all price movements over the past month have taken place within the 1.1114–1.1267 sideways channel. Therefore, most of the pair's short-term movements may simply be market noise ahead of a new trend. EUR/USD has been trading in a completely illogical manner in recent months, largely disregarding fundamental and macroeconomic factors. There is even less reason to look for any logic in price movements within a sideways range. Thus, the sideways movement continues, and this is the main point. Of course, it is possible that the dollar declined yesterday due to easing geopolitical tensions in the Middle East and Eastern Europe. However, the pair has been trading sideways near the market lows for more than a month. Therefore, the 50-point decline in the US dollar has had no impact on the technical picture or the overall market situation. There were no important economic releases or events in the European Union or the United States yesterday.
EUR/USD 5M Chart.
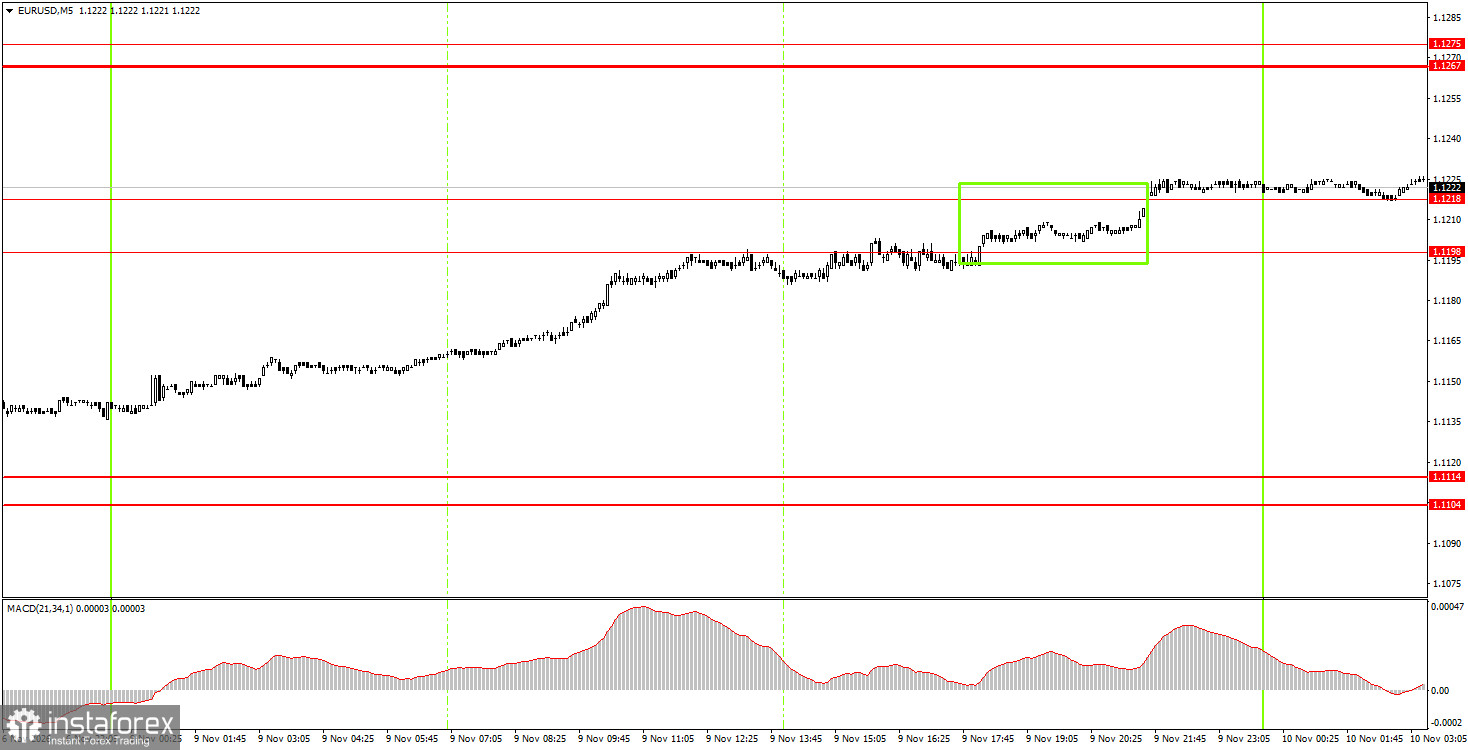
One buy signal was formed on the 5-minute timeframe on Monday. Unfortunately, it appeared almost at the very end of the upward move. The price managed to break above the 1.1198–1.1218 level, although not without difficulty, which supports the possibility of further gains within the sideways channel today. Unfortunately, before the next upward move began, the pair failed to reach the lower boundary of the sideways channel.
On the hourly timeframe, EUR/USD maintains a downward trend, which remains a fully established trend, while the pair continues to trade sideways between 1.1114 and 1.1267. The euro has failed to stage a proper correction in recent weeks, but the possibility of an upward trend has not been ruled out. Considering all the developments of recent months, there is no reason to believe that the euro should have declined sharply and continuously. At present, the US dollar is significantly overbought, while a large number of factors supporting the euro's appreciation are being ignored.
On Tuesday, beginner traders may open short positions if the price consolidates below the 1.1198–1.1218 level, with a target of 1.1104–1.1114. Buy trades may be opened after the price consolidates above the 1.1198–1.1218 level, with a target of 1.1267–1.1275.
On the 5-minute timeframe, the following levels should be considered: 1.1011, 1.1104–1.1114, 1.1198–1.1218, 1.1267–1.1275, 1.1366–1.1377, 1.1461–1.1474, 1.1527–1.1531, 1.1584–1.1594, and 1.1655–1.1665. On Tuesday, the United States will release its October inflation report. This is essentially the only major event scheduled for today and the most important event of the week. Volatility may increase during the second half of the day.
Support and resistance price levels (zones) are levels that serve as targets when opening buy or sell positions or as potential sources of trading signals.
Red lines represent channels or trendlines that show the current trend and indicate the preferred direction for trading.
MACD indicator (14, 22, 3) – the histogram and signal line serve as supplementary indicators that can also be used as sources of trading signals.
Important speeches and economic reports (listed in the economic calendar) can have a significant impact on currency pair movements. Therefore, trading should be approached with extreme caution when such events take place. Alternatively, positions can be closed to avoid a sharp price reversal against the preceding movement.
Beginner Forex traders should remember that not every trade can be profitable. Developing a clear trading strategy and following sound money management principles are essential for long-term trading success.


